Economic and Financial Performance
in all segments
Economic Situation
The economic environment was consistently challenging throughout 2014. Two major events captured everyone’s attention–the FIFA World Cup and the presidential election–, and Brazil fell into a technical recession. Another concern was the increase in public spending.
In addition, the Brazilian economy is plagued by inflationary pressure. Inflation as measured by IPCA [Broad Consumer Price Index] remained high and stood at 6.41%, slightly below the Central Bank's target ceiling, at the close of 2014. In an attempt to check inflation, the government increased by 1.75 p.p. the benchmark interest rate, which stood at 11.75% at the close of 2014.
However, the average unemployment rate remained low and closed the year at 6.8%, a drop in relation to 2013.
A fiscal adjustment, cuts in public spending, a rise in taxes and adjustments in government-controlled prices are all expected for 2015.
The impacts of this situation on our main lines of business, Telecom and Agribusiness, are mitigated by the fact that demand is connected with population growth. The Telecom segment has also been driven mainly by increased consumption of data traffic whereas domestic and international demand for food is still impacting Agribusiness positively.
In line with our values of long-term investments and confidence in our business segments, we focus our CAPEX especially on Telecom and Agribusiness. Some of the highlights were the acquisition of Asyst; the 4G auction; the agreement to lay a submarine cable between Santos, São Paulo State, Brazil, and Boca Raton, Florida, USA; and the replacement of boilers in the Algar Agro plant in Uberlândia (Minas Gerais State).
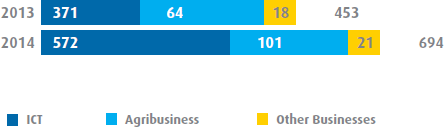
NET REVENUE
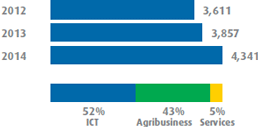
Net Operating Revenues
Our consolidated net revenue amounted to R$4,341 million at the close of 2014, up 12.6% vs. the R$3,857 million recorded at the close of 2013. The performance of all the Group’s different businesses contributed positively to this result. The Agribusiness segment’s net revenue, which accounted for 43.2% of the consolidated net revenue, rose by 5.7% driven by an increase in soybean origination. The 18.4% higher revenue of the ICT segment added R$348 million to total net revenue. This rise resulted from the increases in BPO and IT Integrated Solutions largely due to the acquisition of Asyst, as well as higher revenue from corporate clients in the Telecom’s segment’s area of expansion.
COGS
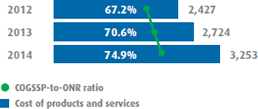
Cost of Goods Sold and Services Provided
In 2014, our operating costs came to R$3,253, up 19.4% from the R$2,724 million recorded in 2013. The cost-to-net-revenue ratio stood at 70.6% in 2013 against 74.9% in 2014, which is explained by the increase in Algar Agro and the Asyst merger.
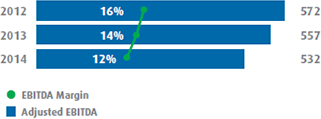
EBITDA and EBITDA Margin
Operating cash generation as measured by EBITDA came to R$532 million in 2014, down 3% from R$557 million in 2013. On the same basis for comparison, EBITDA margin fell by 2.0 p.p. to 12% at the close of 2014.
EBITDA and EBITDA Margin
The ICT and Services segments had positive EBITDA whereas the Agribusiness segment had negative EBITDA. Between 2013 and 2014, ICT recorded the highest increase, of 14%. This expansion in the ICT segment is related to the performance of the broadband, data, BPO and IT products, as well as greater operational efficiency. On the other hand, the Agribusiness segment recorded a drop in the same period, explained by higher prices of variable inputs (components of industrial costs), freight costs in domestic sales and fobbing costs in exports (port tariffs). They were also negatively impacted by overhead expenses due to the organizational restructuring.
The Group reported a net financial loss of R$281 million, vs. R$298 million in 2013.
There was improvement in financial accounts due to:
I) lower impact from exchange rate variations;
II) lower bank spreads in financing negotiations; and
iii) a drop in inventory purchases during the year.
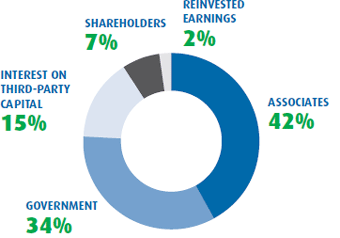
Net Income
The Algar Group’s net income totaled R$78 million in 2014, a 56% drop over the R$177 million recorded in 2013. This change is explained by the loss recorded by Algar Agro, which was impacted by the fall in crop prices, reflecting the mark-to-market of assets. The margin over net operating revenue was 1.8% in 2014, down 3.2 p.p. year-over-year.
Debt
On December 31, 2014, we had a consolidated gross debt of R$2,493 million, a 24.5% rise year-over-year. Since cash and cash equivalents amounted to R$360 million and the soybean inventory to R$460 million, net debt stood at R$1,727 million at the close of 2014. Higher debt was due to the investments in the Telecom segment, which involved R$200 million raised through the 3rd issue of debentures in April 2014, in addition to investments and the need for working capital at Algar Agro.
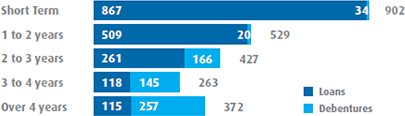
GROSS DEBT
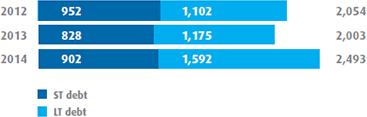
Debt aging 2014