The Eternit way of building
Operating, economic and financial performance
OPERATING PERFORMANCE
Chrysotile Mineral Sales (‘000 t)*
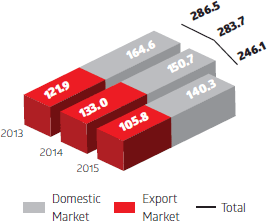
Chrysotile Mineral
In 2015, chrysotile mineral sales volume came to 246,100 tons, down 13.3% from 2014. In the same comparison period, domestic sales contracted 7.0%, mainly due to the lower demand for construction materials. Meanwhile export sales fell 20.5%, which is explained by stiffer competition (Russia and Kazakhstan) following the sharp drop in export prices on the strong appreciation in the U.S. dollar in these countries, and by the lower sales to India due to higher competition in steel roofing panels given low prices for iron ore.
SAMA maintained its position as one of the world's three largest chrysotile producers in 2015..
(*) Chrysotile asbestos sales include intercompany sales, which accounted for 44.6% of domestic sales in 2015.
Fiber-Cement Sales (‘000 t)
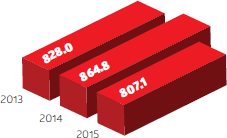
Fiber-cement panels
In 2015, sales volume of fiber-cement, including construction solutions, amounted to 807,100 tons, decreasing 6.7% from 2014, mainly due to the slowdown in the construction materials industry, mounting unemployment, lower household income, credit restrictions and the slower pace of renovations.
Eternit maintained its leadership in Brazil's fiber-cement industry in 2015, with market share above 30%.
Concrete Roofing Tile Sales (‘000 t)
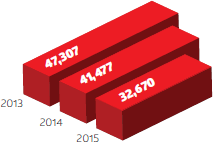
Concrete Roofing Tiles
In 2015, concrete tile sales volume amounted to 32,670,000 units, down 21.2% from 2014, reflecting the weaker demand in the industry, as well as waning consumer confidence and a slowdown at contractors due to economic uncertainties.
Tégula maintained its leadership in Brazil's concrete roofing tile industry in 2015, with market share of 30%.
 Eterplac Stone application
 Bathroom chinaware application - Alina model
ECONOMIC AND FINANCIAL PERFORMANCE
Consolidated Net Revenue
In 2015, consolidated net revenue amounted to R$974.9 million, virtually stable (down 0.3%) compared to 2014. Exports amounted to R$195.1 million, an increase of 11.6% from 2014, driven by the 41.6% appreciation in the U.S. dollar against the Brazilian real (based on the average PTAX rate in the period), which completely neutralized the lower sales volume. Meanwhile, the domestic market contracted 2.9%, reflecting the slowdown in the construction materials industry.
Breakdown of Consolidated Net Revenue (2015)
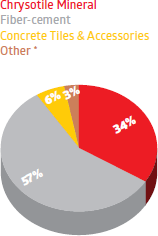
(*) Other: metal bathroom fixtures, metal roofing panels,
polythene water tanks, construction solutions and other products.
Consolidated Net Revenue (R$ million)
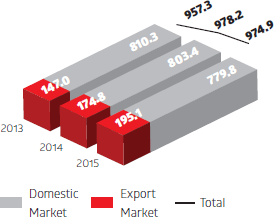
Cost of Goods Sold
In 2015, consolidated cost of mining, production and goods amounted to R$598.1 million, virtually stable (up 0.7%) in relation to 2014. Consequently, gross margin remained stable in the comparison period to end the year at 39%.
The main variations in the operating segments were:
• Chrysotile mineral: increase of 4%, explained by the adjustment to capacity utilization to balance inventory levels and the ensuing increase in fixed costs due to production volume, as well as by higher material costs (mainly fuel) and higher electricity rates.
• Fiber-cement: increase of 3%, due to the hikes in electricity rates and the higher costs with materials, equipment and services for plant maintenance.
• Concrete roofing tiles: despite the 9% decrease in cost of goods sold due to the lower sales volume, unit costs increased owing to the higher electricity rates, increased consumption of materials and accessories and lower productivity levels.
Breakdown of Costs (2015)
Fiber-cement
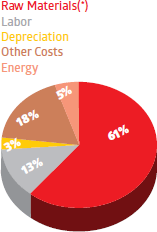
(*) Raw materials: cement (43%),
chrysotile mineral (42%) and other (15%).
Chrysotile Mineral
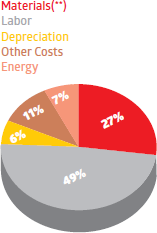
(**) Materials: fuel, explosives,
packaging and other
Concrete Roofing Tiles
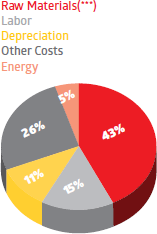
(***) Raw materials: cement (53%),
sand (30%) and other (17%).
 Aerial view of SAMA mining
Operating Expenses
In 2015, operating expenses amounted to R$257.0 million, up 5.8% on 2014, due to the non-recurring provision for labor contingencies involving Public-Interest Civil Actions in São Paulo filed by the Labor Prosecution Office and by the Brazilian Association of Persons Exposed to Asbestos (ABREA). The claims are deemed as probable by the Company’s legal counsel and their effect was neutralized partially by the reduction in direct operating expenses on the lower sales volume (selling expenses), by the decrease in the provision for profit sharing explained by the lower profit for the year, and by deferred social security and PIS/COFINS tax credits recorded in other items under operating expenses.
| In R$ ‘000 | 2013 | 2014 | 2015 | Var % |
|---|---|---|---|---|
| Selling expenses | (116,734) | (116,528) | (114,704) | (1.6) |
| General and administrative expenses | (113,349) | (122,465) | (118,405) | (3.3) |
| Other operating (expenses) revenue | (1,871) | (3,810) | (23,844) | 525.8 |
| Total operating expenses | (231,954) | (242,803) | (256,953) | 5.8 |
| Percentage of Net Revenue | 24% | 25% | 26% | 1 p.p. |
Equity Pickup
Equity pickup refers to the proportional gain or loss from the bathroom chinaware plant in the state of Ceará, the joint venture Companhia Sulamericana de Cerâmica (CSC). In 2015, equity pickup was negative R$27.7 million, compared to negative R$13.7 million in 2014. The increase is primarily related to the low capacity utilization and negative exchange variation.
Net Financial Result
In 2015, the net financial result was an expense of R$23.5 million, compared to the income of R$2.3 million in 2014, which is mainly explained by the effects from the exchange variation loss on the Company’s foreign-denominated debt, as well as by the higher interest on borrowings and the lower gain from financial investments.
| In R$ ‘000 | 2013 | 2014 | 2015 | Var % |
|---|---|---|---|---|
| Financial expense | (48,553) | (52,674) | (108,735) | 106.4 |
| Financial income | 47,535 | 54,962 | 85,209 | 55.0 |
| Net financial result | (1,018) | 2,288 | (23,526) | - |
Adjusted EBITDA
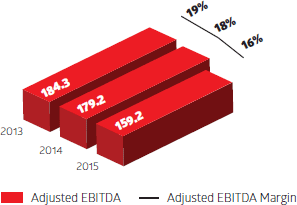
Adjusted EBITDA was R$159.2 million in 2015, down 11.1% from 2014, with margin of 16%, which is mainly explained by the 2% drop in gross operating income (net effect from the lower sales volume and higher chrysotile exports on the weaker Brazilian real) and by the higher operating expenses, as mentioned above.
Reconciliation of consolidated EBITDA
| In R$ ‘000 | 2013 | 2014 | 2015 |
|---|---|---|---|
| Net income | 102,256 | 85,160 | 29,421 |
| Income tax and social contribution | 39,973 | 44,924 | 39,196 |
| Net financial result | 1,018 | (2,288) | 23,526 |
| Depreciation and amortization | 34,789 | 37,704 | 39,401 |
| EBITDA 1 | 178,036 | 165,500 | 131,544 |
| Equity pickup | 6,223 | 13,676 | 27,661 |
| Adjusted EBITDA on equity pickup 2 | 184,259 | 179,176 | 159,205 |
1 With the operational startup of the joint venture Companhia Sulamericana de Cerâmica (CSC), its results are included in consolidated EBITDA in accordance with the equity pickup method, in conformity with Instruction 527 of October 4, 2012, issued by the Securities and Exchange Commission of Brazil (CVM).
2 Adjusted EBITDA is an indicator used by the Company's Management to analyze the operational and economic performance of its consolidated business, excluding equity pickup due to the fact that CSC is a joint venture and its information is not consolidated.
Net Income
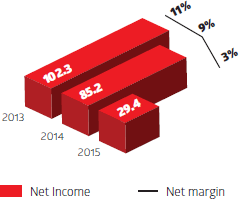
Eternit posted net income of R$29.4 million in 2015, down 65.5% from 2014. Net margin contracted 6 percentage points to end the year at 3%, reflecting the same factors affecting adjusted EBITDA, as well as the higher financial expenses arising from the effects from exchange variation on debt.
Adjusted EBITDA (R$ million) and
Adjusted EBITDA Margin (%)
Net Income (R$ million)
and Net Margin (%)
Debt
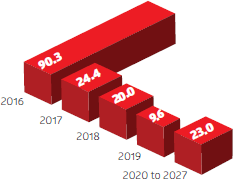
The Company ended 2015 with net debt of R$144.9 million, equivalent to 0.91 times adjusted EBITDA in the last 12 months. In 2015, the gross debt of Eternit and its subsidiaries amounted to R$167.3 million, mainly reflecting: (i) the Bank Credit Notes (CCB) and Export Credit Notes (NCE) contracted to meet working capital needs; and (ii) the financing facilities for the acquisition of machinery and equipment.
Cash, cash equivalents and short-term investments came to R$22.3 million, with investments remunerated at average rates corresponding to: (i) 94.1% of the variation in the overnight rate (CDI) for short-term investments (repo operations); and (ii) 100.9% of the variation in the CDI for long-term investments (investment funds), resulting in a weighted average rate of 95.8% of the variation in the CDI.
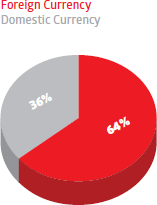
Foreign-denominated debt on December 31, 2015 was 100% naturally hedged by accounts receivable in foreign currency from chrysotile exports.
| Debt – R$ ‘000 | 2013 | 2014 | 2015 |
|---|---|---|---|
| Net debt – short term | 56,881 | 88,946 | 90,307 |
| Net debt – long term | 25,799 | 38,978 | 76,954 |
| Cash and cash equivalents | (13,295) | (13,367) | (5,578) |
| Short-term financial investments | (35,661) | (35,023) | (16,734) |
| Net debt | 33,724 | 79,534 | 144,949 |
| EBITDA (in last 12 months) | 178,036 | 165,500 | 131,544 |
| Net Debt / EBITDA (x) | 0.19 | 0.48 | 1.10 |
| Adjusted EBITDA on equity pick-up (in last 12 months) | 184,259 | 179,176 | 159,205 |
| Net Debt / Adjusted EBITDA (x) | 0.18 | 0.44 | 0.91 |
| Net Debt / Equity | 6.7% | 15.4% | 29.0% |
Debt by currency (%)
Amortization flow (R$ million)
CAPEX
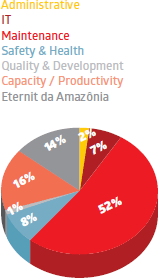
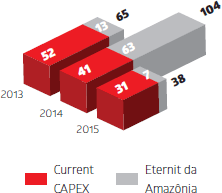
In 2015, CAPEX amounted to R$37.9 million, decreasing 63.6% from the prior year, allocated as follows: (i) R$ 31.4 million to maintaining and modernizing the Group’s industrial facilities; and (ii) R$6.5 million to the construction of the research, development and production unit for construction material inputs in Manaus, Amazonas.
In addition to the CAPEX in 2015, the Company made capital contributions to the joint venture CSC in the amount of R$18.1 million. In 2013 and 2014, these contributions amounted to R$29.2 million and R$12.0 million, respectively.
CAPEX for 2016 is projected at approximately R$21 million, for allocation to the maintenance and modernization of industrial facilities, however, this amount does not include any capital injections at subsidiaries.
CAPEX Distribution (%)
Consolidated CAPEX (R$ milhões)
Value Added G4-EC1
Value added in the year amounted to R$497.9 million, down 8.9% from 2014. Of this amount, 37.9% was distributed to employees and 30.2% to the federal, state and municipal governments in the form of taxes and contributions. Shareholders received 5.9% of the value added generated, while 26.0% went to the payment of interest on loan capital.
| R$ ‘000 | 2013 | 2014 | 2015 |
|---|---|---|---|
| VALUE ADDED TO DISTRIBUTE | 531,730 | 546,448 | 497,859 |
| Personnel | 184,431 | 191,345 | 188,694 |
| Taxes and contributions | 173,547 | 193,814 | 150,266 |
| Value distributed to providers of capital | 71,498 | 76,130 | 129,479 |
| Value distributed to shareholders | 102,254 | 85,159 | 29,420 |
| DISTRIBUTION OF VALUE ADDED | 531,730 | 546,448 | 497,859 |
Capital Markets
Eternit has been listed on the stock exchange since 1948, and since 2006 its stock has been traded on the Novo Mercado, the segment of the São Paulo Stock Exchange (BM&FBOVESPA) with the highest corporate governance standards, under the stock ticker ETER3. The stock is a component of four stock indexes on the exchange, namely: Special Corporate Governance Index (IGCX), Corporate Governance Index - Novo Mercado (IGNM), Industrial Sector Index (INDX) and Special Tag-Along Stock Index (ITAG).
With highly disperse ownership and no shareholders' agreement or controlling group, the Company’s shareholder base has a high concentration of individual investors, who accounted for 70.6% of the shareholder base on December 31, 2015, while foreign investors accounted for 7.9% and legal entities, clubs, investment funds and foundations accounted for 21.5%.
At the end of 2015, the company had 11,025 shareholders, an increase of 17.8% from the number of registered shareholders in 2014. The Company’s free-float ended the quarter at 84.7%, excluding treasury shares and shares held by the Management, in accordance with the methodology of the Novo Mercado Regulations.
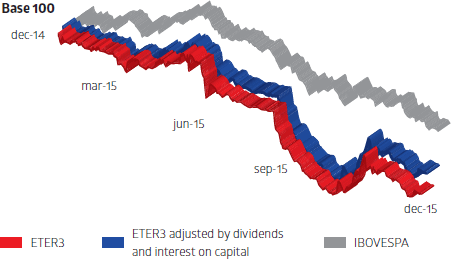
Eternit stock (ETER3) was quoted at R$2.09 in December 2015, down 35.7% from the quote in December 2014. In the same period, the benchmark Bovespa Index (IBOVESPA) closed at 43,349 points, representing a decline of 13.3%. On December 30, 2015, Eternit's market capitalization stood at R$374.1 million.
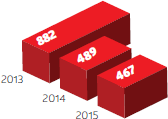
Liquidity – average daily trading volume (R$ ‘000)
Closing stock quote* (R$)
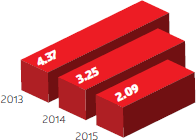
* Closing price on the last day of the period. The stock quote for 2013 was adjusted for the stock split approved on September 24, 2014.
Proventos
In 2015, the dividend yield1 reached 9.0% and the dividends and interest on equity distributed by the Company amounted R$52.6 million, which represents a R$ 0.2940 per share.
Dividend Yield Growth (%)
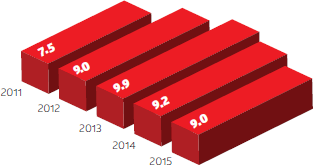
More information is available in the section Investor Information – Dividend Policy of the IR website (www.eternit.com.br/ir).
1 Dividend yield: share-based payments (dividends + interest on equity) per share distributed during the year (base: payment date) divided by the closing stock price at the end of the prior year.
Cancelation of Level 1 ADR Program
In April 2015, Eternit announced the cancellation of its Level 1 American Depositary Receipts (ADRs) Program at the U.S. Securities and Exchange Commission (SEC) due to the low volume of ADRs traded. ADRs are receipts of shares issued by companies not listed on U.S. stock exchanges that are available for trade on the Over-the-Counter (OTC) market. Eternit’s ADRs began to be traded under the symbol ETNTY in 2012, after the program was approved by the Securities and Exchange Commission of Brazil (CVM) and implemented by the SEC in 2010.
Ownership structure
On December 31, 2015, Eternit’s fully subscribed and paid-in capital stock amounted to R$334.2 million and was represented by 179 million common shares without par value and with the right to vote in shareholders’ meetings.
With no shareholders' agreement or controlling group, the Company’s share ownership is highly disperse. On December 31, 2015, it shareholder base was formed 70.6% by individuals; 1.8% by legal entities; 7.9% by foreign investors; and 19.7% by investment clubs, funds and foundations.
In 2015, only three shareholders held interests of over 5.0%, corresponding to 35.3% of the free-float, while the Officers held 1.0%.
In 2015, the shareholder base expanded by 17.8% compared to 2014, to 11,025 investors.
| 2011 | 2012 | 2013 | 2014 | 2015 | ||||||
|---|---|---|---|---|---|---|---|---|---|---|
| Number | % | Number | % | Number | % | Number | % | Number | % | |
| Individuals | 6,302 | 61.3 | 6,745 | 60.8 | 7,866 | 61.0 | 9,012 | 65.1 | 10,753 | 70.6 |
| Legal entities | 126 | 4.6 | 91 | 2.0 | 97 | 1.8 | 94 | 1.8 | 93 | 1.8 |
| Clubs, funds and foundations | 132 | 27.0 | 177 | 26.3 | 131 | 24.4 | 114 | 22.7 | 88 | 19.7 |
| Foreign residents | 73 | 7.1 | 131 | 10.9 | 146 | 12.8 | 137 | 10.4 | 91 | 7.9 |
| TOTAL | 6,633 | 100.0 | 7,144 | 100.0 | 8,240 | 100.0 | 9,357 | 100.0 | 11,025 | 100.0 |
Investor Relations
In its constant pursuit of transparency and equitable treatment in its relations with all stakeholders, the corporate governance model adopted by Eternit is based on best market practices. Investors, analysts and other shareholders can communicate with the Company through the Investor Relations area, which has a team of professionals prepared to meet the demands of market participants in a timely and equitable manner. The Company also has other channels for communicating with the market, such as its IR website (www.eternit.com.br/ir).
The IT department is also responsible for organizing the Shareholders' Meetings jointly with the Legal department, holding quarterly conference calls with webcasts and public meetings, publishing releases and fact sheets, organizing road shows and holding one-on-one meetings with investors.
Since 2010, Eternit gives shareholders the option of accessing Shareholders Meetings via an online platform, which allows them to participate from any place in Brazil or the world through an electronic proxy process.
In 2015, various contacts were made with investors, shareholders and analysts, and three public meetings were held jointly with the regional chapters of the Association of Investment and Capital Market Analysts and Professionals (APIMEC) in the cities of Belo Horizonte (MG), Porto Alegre (RG) and Rio de Janeiro (RJ).